clearString chart example |
Integrating ChartsIt is easy to add charts to your site
In this site we use the chartjs tool, which is available under the MIT license. To make the example clear we have kept it simple - so the result isn't the most amazing looking chart - what's important here are the techniques for getting the chart on the page and integrated with the data. More powerful libraries are also available, and integrate in the same way. A list can be found here, or ask Google. Most chart tools will give you example code where the data is entered as a static array of values. This is great, and allows you to experiment with the chart appearance, but the real power arrives when you can pull the data from your database. Fortunately this is also easy, and just requires a few lines to integrate. Note: This guide assumes you have already followed our quick Introductory tutorial to equip you with general site management and editing skills.
Getting StartedThe chartjs tool is provided via a single file, chart.js, which we need to upload into our site. (For your site you can copy the version we use here, but you would do best to take the latest version from the chartjs site, just in case there have been any improvements to it). To upload it to the site, we add an Upload component to the site, and upload the file into it. On this site the Upload component is at /9. Make a note of the equivalent page number for your site, as you'll need it in the script later. The chart tool we are using is based on jQuery. We need to reference the jQuery script file, but since this is generally available we don't need to upload it and host it on our site, but can simply reference an externally-hosted copy.
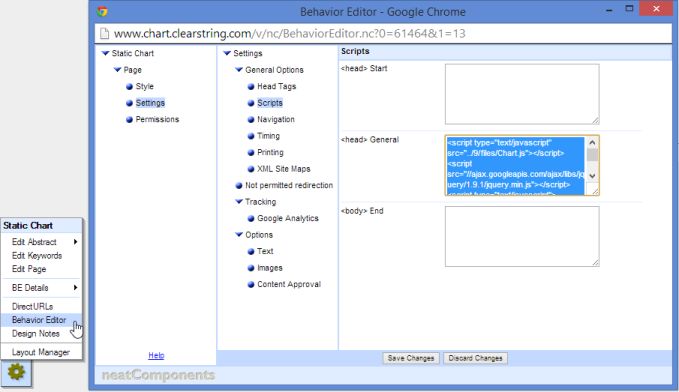
Creating a Static ChartBefore we integrate data from the database, we prove the chart tool is working by creating a static chart. The script for this is lifted straight from the chartjs documentation. For this page we do two things: 1) On the Page itself (Toolbox, Edit Page, Source) we add in the following to show where we want the chart to appear: <canvas height="400" id="trChart" width="400"></canvas>This gives a name for the chart - trChart - which we will reference in the script, and defines a size for it. 2) On the Behavior Editor (Toolbox, Behavior Editor), Page, Settings, Scripts, <Head> General:
Paste in the following (copied from their documentation): <script type="text/javascript" src="../9/files/Chart.js"></script> <script src="//ajax.googleapis.com/ajax/libs/jquery/1.9.1/jquery.min.js"></script> <script type="text/javascript"> function createChart() { var data = { labels: ["Apr", "May", "Jun", "Jul", "Aug", "Sep"], datasets: [ { fillColor: "rgba(225,0,0,1)", strokeColor: "rgba(225,0,0,1)", data: [12, 16, 13, 15, 18, 21] }, { fillColor: "rgba(0,26,225,1)", strokeColor: "rgba(0,26,225,1)", data: [18, 16, 17, 17, 18, 16] }, { fillColor: "rgba(24,31,28,0.5)", strokeColor: "rgba(24,31,28,0.5)", data: [11, 16, 9, 10, 17, 17] } ] } var cht = document.getElementById('trChart'); var ctx = cht.getContext('2d'); var barChart = new Chart(ctx).Bar(data); } </script> <script type="text/javascript"> //<![CDATA[ $(document).ready(function(){ createChart(); }); //]]> </script> Highlighted in yellow are the parts you may need to adjust for your site: ../9/files/Chart.jsThis is the path to the js file you uploaded. trChartThis is the id of the canvas that was entered in the page body. And that's it - the page shows your static chart.
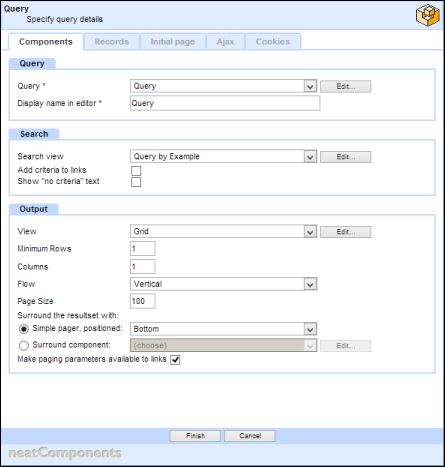
Creating a Database-driven ChartFor this simple example, we have created a Table containing the same data as was used in the Static Chart example above. You can see and edit the data using the Data Entry Form here. To get the data on to the page we create a Query based on the Table. To make the example a little more interesting (and realistic) we have also configured a Query by Example search on the Query, to allow the user to specify a date range for the data they would like to see. (You could obviously skip this in your integration). With the data ready, we need to get it on our page, and build a chart from it: 1) On the Page itself (Toolbox, Edit Page, Source) we add in the following to show where we want the chart to appear: <canvas height="400" id="trChart2" width="400"></canvas> This gives a name for the chart - trChart2 - which we will reference in the script, and defines a size for it. 2) Still in the page editor, but out of Source mode, we embed the Query (and in our case, we specify it should use the Query by Example for the search)
3) Switch back into Source view, and surround the <div class="ncEmbed"...</div> with another div tag pair, to identify this as containing the data for the chart. In this case we use an id value of chartData. Make a note of this id value, as we will need it later in the script. <div id="chartData"> <div class="ncEmbed" data="Embed.12.1" style="background-image: url('../v/nc/GetEmbedImage.nc?t=Query');">[e]</div> </div>
4) On the Behavior Editor (Toolbox, Behavior Editor), Page, Settings, Scripts, <Head> General, paste in the following: <script type="text/javascript" src="../9/files/Chart.js"></script> <script src="//ajax.googleapis.com/ajax/libs/jquery/1.9.1/jquery.min.js"></script> <script type="text/javascript"> //<![CDATA[ $(document).ready(function(){ createChart2(); }); function createChart2(){ var data = { labels: [], datasets: [ { fillColor: "rgba(225,0,0,1)", strokeColor: "rgba(225,0,0,1)", data: [] }, { fillColor: "rgba(0,26,225,1)", strokeColor: "rgba(0,26,225,1)", data: [] }, { fillColor: "rgba(24,31,28,0.5)", strokeColor: "rgba(24,31,28,0.5)", data: [] } ] } var dataColCount = 3; $('#chartData tr').filter(':gt(0)').each(function(){ data.labels.push($('td:first', this).text()); for(var i = 0; i < dataColCount; i++){ data.datasets[i].data.push(parseFloat($('td:eq(' + (i + 1) + ')', this).text())); } }); var cht = document.getElementById('trChart2'); var ctx = cht.getContext('2d'); var barChart = new Chart(ctx).Bar(data); } //]]> </script> Highlighted in yellow are the same items you need to adjust for your site that we described for the Static chart example. Highlighted in green is the reference to the div id where the chart data is to be found. And that's it - the page asks for the data range. Select some dates (or just click 'View' to see it all), and it will show the chart for your data.
Building your own chartsLooking at the script for the database-driven chart, we see it is designed for three columns of data - if your dataset is different you will need to adjust it accordingly, changing the datasets array, and the dataColCount variable. It also assumes that the first row of your data will contain the labels for the chart. In our example the chart data is visible on the page. If you want the data to be hidden, so only the chart is visible simply set the surrounding div on the embedded query to be styled hidden. As noted at this start, this example uses chartjs, but there are many other similar tools available. While the specifics of these will differ, the same principles seen here will apply. |
| Website copyright and all rights reserved. |